The Integrated Model
Not random industries. Deliberately engineered operations where each reinforces the others through material flows, energy efficiency, and shared infrastructure.
Material closes the loop. Waste becomes feedstock. Byproducts become inputs.
This circularity drives down costs, increases resilience, and fundamentally improves unit economics — funding conservation at scale.
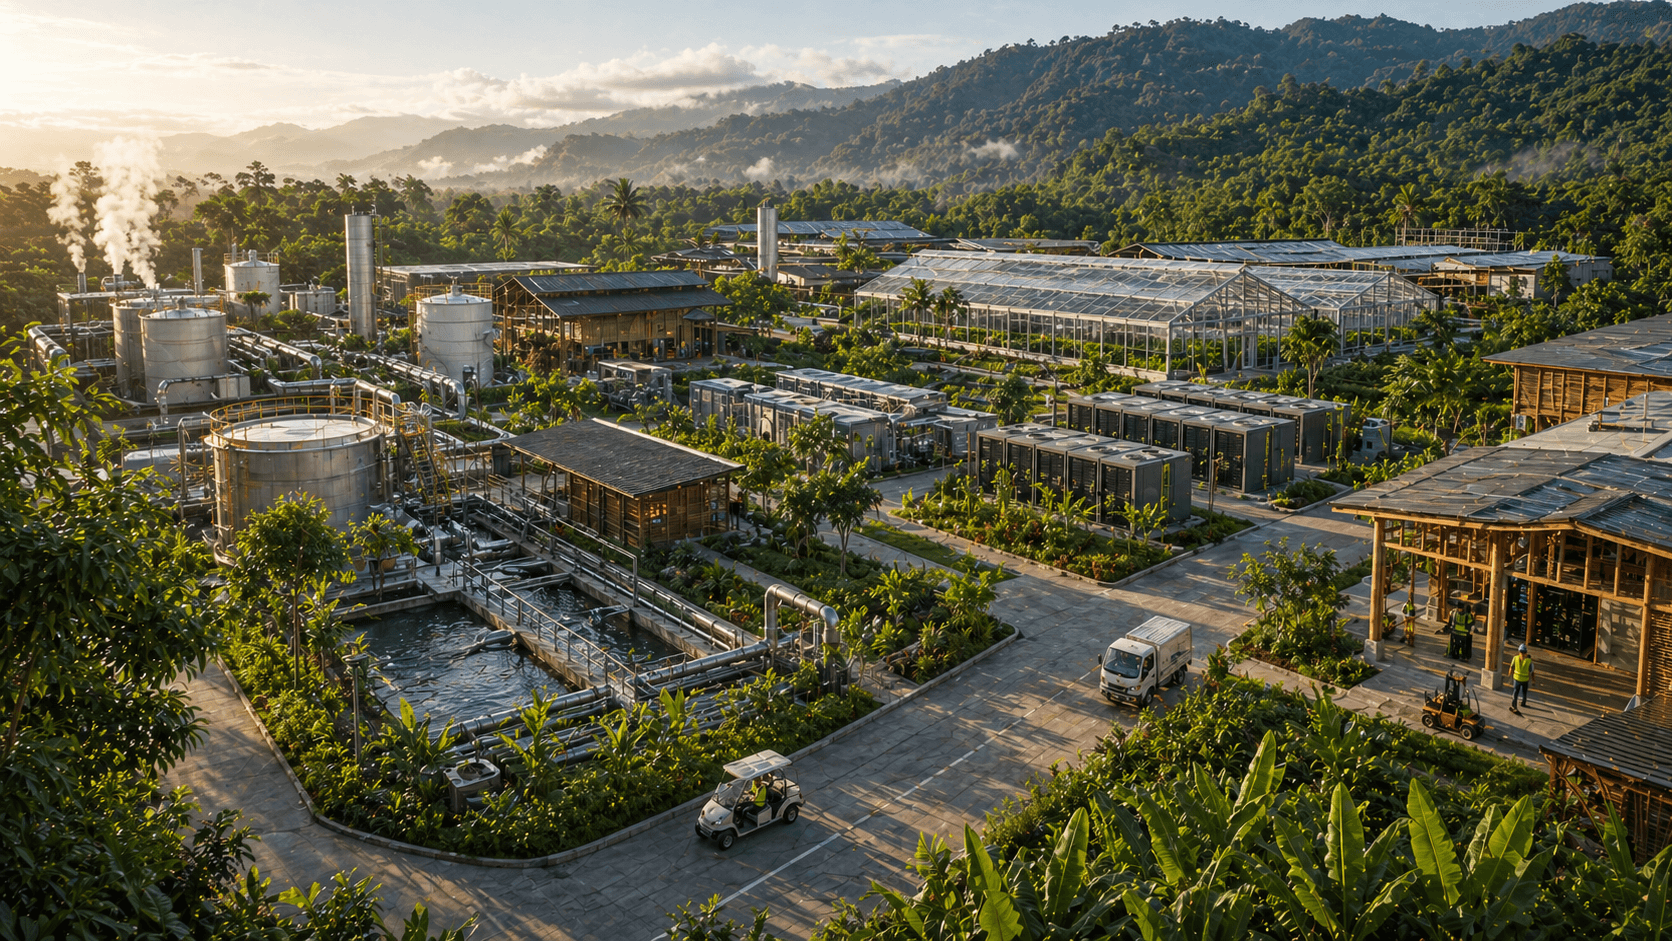
Physical Infrastructure, Not Abstract Theory
The model only works because the industrial district is physically arranged around shared energy, water, mineral, and logistics flows. The economics come from that disciplined layout.
The Material Flows
Energy Anchor → Everything
Geothermal Power (540-665 MW Phase 3) provides baseload renewable power at 50% grid cost.
- › Data centre (150-200 MW consumption)
- › Hydrogen electrolysis (10K t/yr)
- › Desalination pumping
- › Waste heat feeds brine crystallisation
Water to Minerals Pipeline
Data Centre Cooling Demand (12,500 m³/day) justifies desalination.
- › Desalination → fresh water (9,500 m³/day for cooling)
- › Concentrated brine → 3,000 m³/day feedstock
- › Brine crystallisation → pharmaceutical salt, Mg, K, Li
- › Minerals feed downstream operations
Minerals Feed Downstream
Chemical outputs from brine become production inputs across operations.
- › Agriculture: potassium + magnesium fertilisers
- › Construction: adhesives, binding agents
- › HVO: specialty chemicals for catalysis + green H₂
- › Supply chain closure: 20-30% import reduction
The Operations
Baseload renewable power at US$0.04-0.06/kWh — 50% cheaper than grid rates. Phased deployment: 25-35 MW (2026-27) → 65-80 MW (2027-29) → 450-550 MW (2028-32).
Key Outputs
- › Electricity for all operations
- › Waste heat for brine crystallisation
- › Enables hydrogen electrolysis
Economic Impact
Reduces operational energy costs by 50% across all facilities.
The Economics of Integration
Infrastructure Synergies
Operational Synergies
Revenue Enhancement
Risk Reduction
Integrated Financial Performance
Explore Individual Operations
See how each operation functions and integrates with the ecosystem.